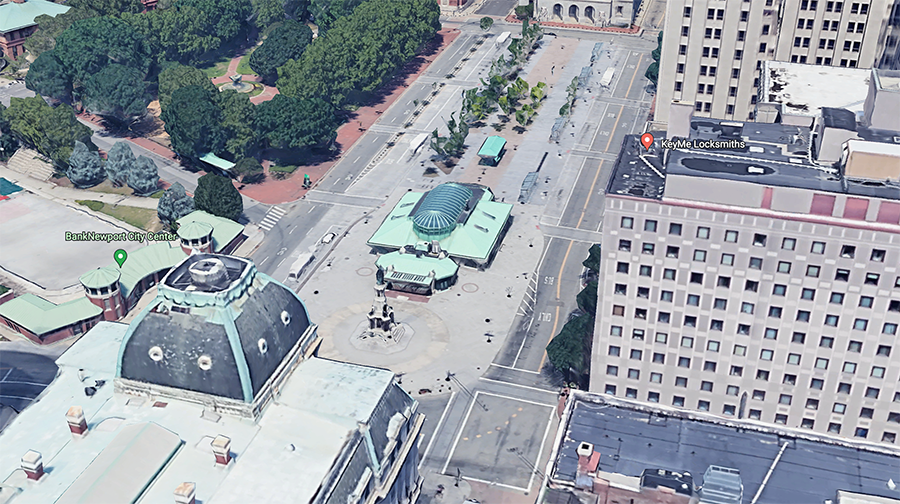
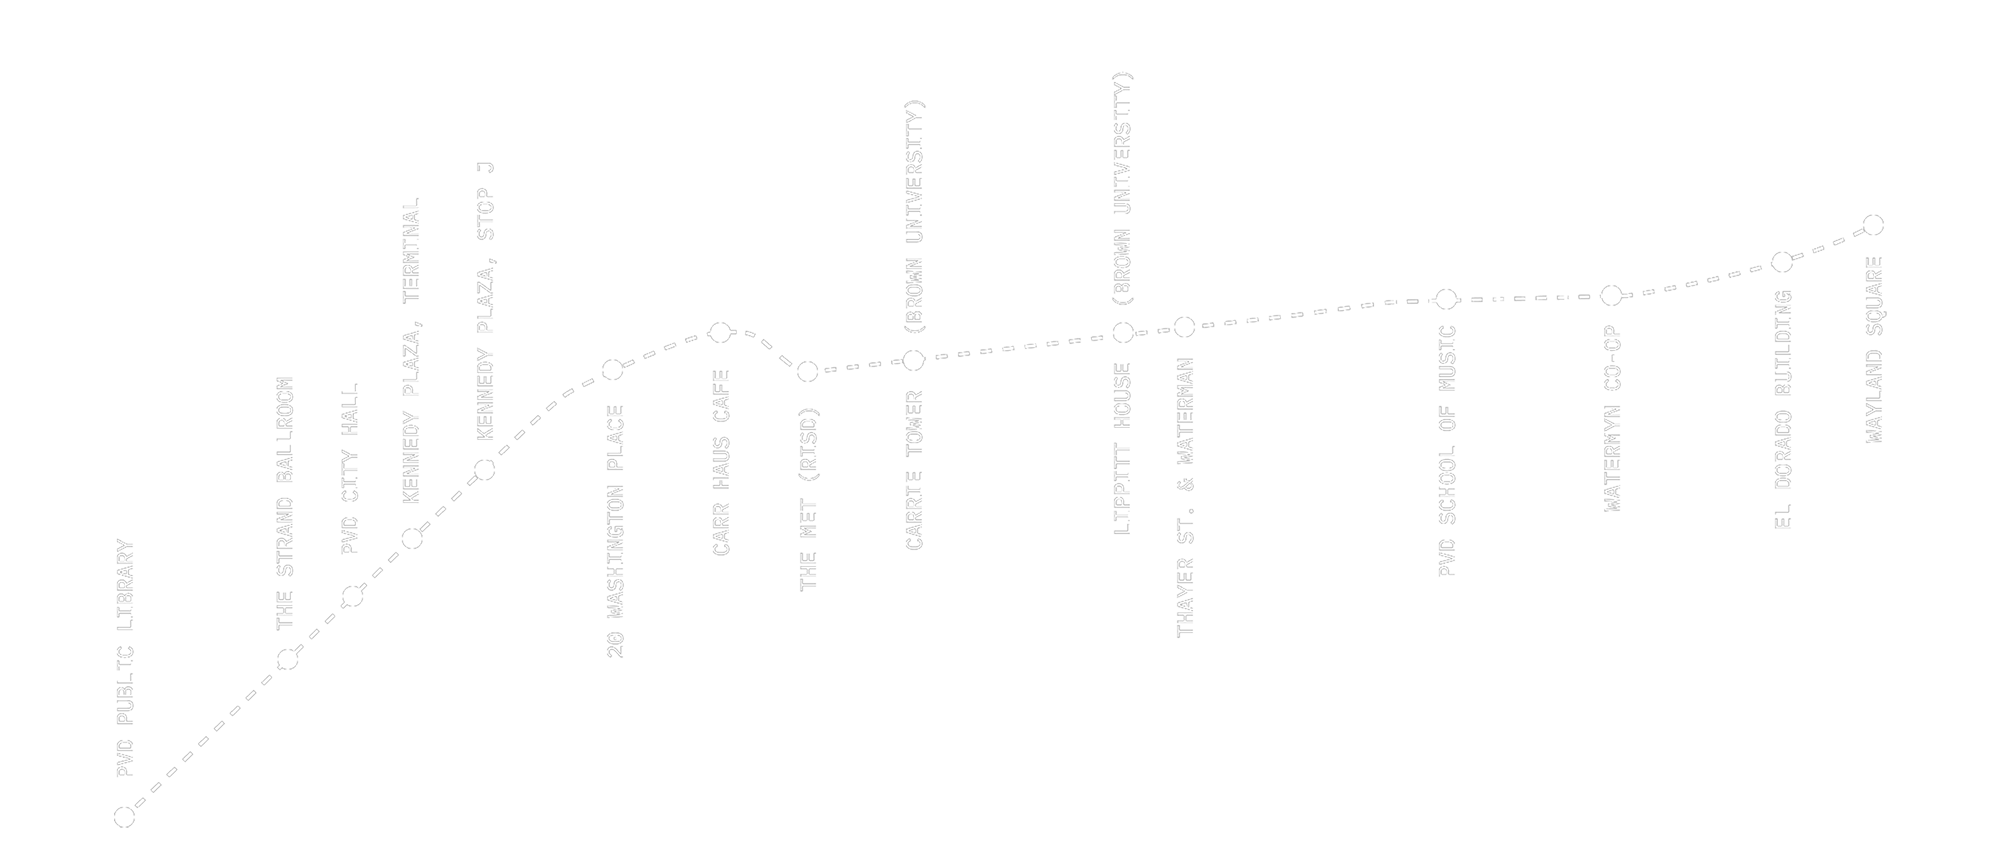
After representing the data through various layers of visual maps as a second phase, we transformed our information and experience into a grid system overlaying a map of Providence. These cells serve as sensory windows/portals. We made manipulations, graphics, and visualizers for each location, capturing an instinctive and visceral representation of the surrounding environment.
Together, these cells layered on the Providence map form a fragmented cityscape that is varied and multisensory.
UNIT 10: MAPPING & VISUALIZING DATA
GRAPH-3226-99: DESIGN STUDIO 3: FALL 2022
RHODE ISLAND SCHOOL OF DESIGN
PROJECT BY DANA ZENG, EVAN LI, & ALEX KIM.
NOVEMBER 06 2022